

In a previous article 🔗 I wrote about the CAP vs RAP distribution captured by the Fiori tools. An update of the numbers were presented at ABAPConf 2026 🔗. The same presentation was also presented at the DSAG KI Thementag. I took the “screenshot” at the DSAG event.
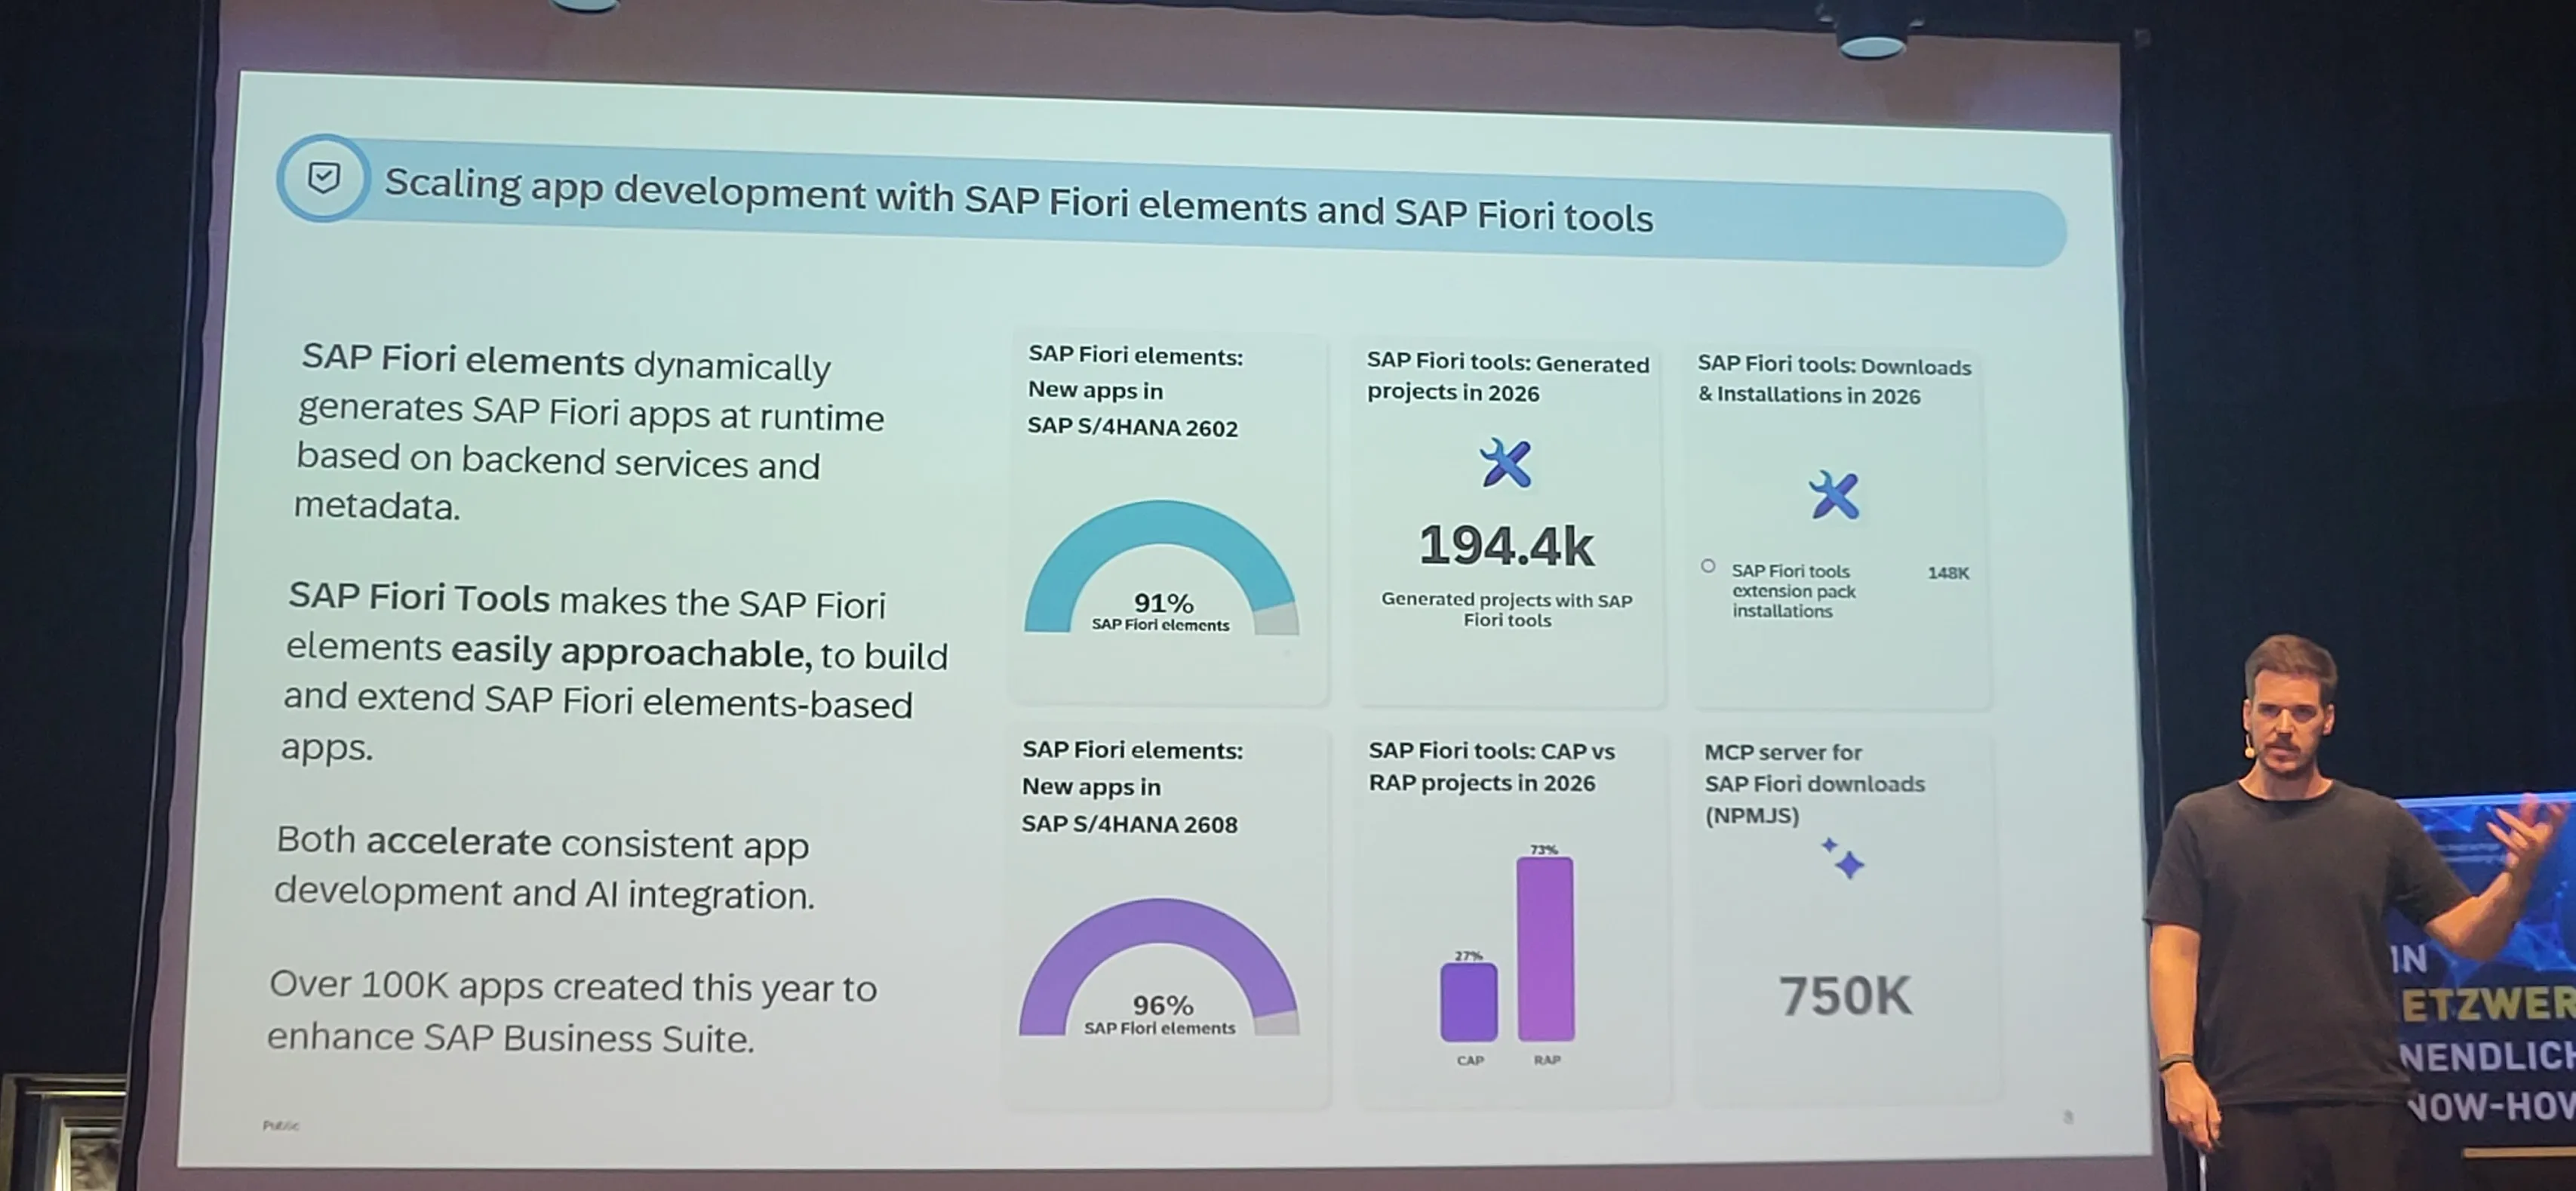
The distribution for 2026 so far is 73% for RAP, 27% for CAP. With this numbers, the updated table for 2025 to 2026 (first 6 month):
| Year | Projects | CAP % | CAP total | RAP % | RAP total |
|---|---|---|---|---|---|
| 2026 (H1) | 194.400 | 27% | 52.488 | 73% | 141.912 |
| 2026 (previous) | 447.000 | 29% | 129.630 | 71% | 317.370 |
| 2025 | 115.000 | 30% | 34.800 | 70% | 80.100 |
I guess the high app number for the previous 2026 number includes the numbers of all apps, incl. 2025. While the new 2026 numbers are only for the first 6 months in 2026.
The numbers are more or less stable, with a slow decline in CAP project %. From 30% down to 27%. Not a trend (yet?). A slight decline and it will be interesting to see how this evolves over time, regarding that now more and more customers roll out SAP S/5HANA systems where RAP cannot only be used, but makes also sense and is fun to use (S/4HANA 2025).