This document explains how to install and configure an environment for analyzing SAP Web Dispatcher (WD) logs with logstash, elasticsearch and Kibana under Linux. Kibana 3 needs a running web server. The example shown here is using nginx, but won’t detail how to set up nginx.
Components referred to in this document:
SAP WebDispatcher
“The SAP Web dispatcher lies between the Internet and your SAP system. It is the entry point for HTTP(s) requests into your system, which consists of one or more SAP NetWeaver application servers.” http://help.sap.com/saphelp\_nw73ehp1/helpdata/en/48/8fe37933114e6fe10000000a421937/frameset.htm 🔗
Logstash
“logstash is a tool for managing events and logs. You can use it to collect logs, parse them, and store them for later use (like, for searching). Speaking of searching, logstash comes with a web interface for searching and drilling into all of your logs.” http://logstash.net/ 🔗
Elasticsearch
“Elasticsearch is a powerful open source search and analytics engine that makes data easy to explore.” http://www.elasticsearch.org/ 🔗
Kibana
“Kibana is an open source, browser based analytics and search dashboard for ElasticSearch.” http://www.elasticsearch.org/overview/kibana/ 🔗
Nginx
“nginx (pronounced engine-x 🔗) is a free, open-source, high-performance HTTP server and reverse proxy, as well as an IMAP/POP3 proxy server.” http://wiki.nginx.org/Main 🔗
Install Elasticsearch
Installation in 3 steps: http://www.elasticsearch.org/overview/elkdownloads/ 🔗
-
Download Elasticsearch 1.4.2 from https://download.elasticsearch.org/elasticsearch/elasticsearch/elasticsearch-1.4.2.tar.gz 🔗
Command: wget https://download.elasticsearch.org/elasticsearch/elasticsearch/elasticsearch-1.4.2.tar.gz 🔗
-
Extract archive
Command: tar –zxvf elasticsearch-1.4.2.tar.gz
-
Start Elasticsearch
Command
cd ealsticsearch-1.4.2
cd bin
./elasticsearch
Install Logstash
Installation in 3 steps: http://www.elasticsearch.org/overview/elkdownloads/ 🔗
-
Command:
wget https://download.elasticsearch.org/logstash/logstash/logstash-contrib-1.4.2.tar.gz 🔗
-
Extract
Command: tar –zxvf logstash-contrib-1.4.2.tar.gz
-
Run logstsash logstash. Before logstash can be run, it must be configured. Configuration is done in a config file.
Logstash configuration
The configuration of logstash depends on the log configuration of WD. Logstash comes out of the box with everything it takes to read Apache logs. In case WD is configured to write logs in Apache format, no additional configuration is needed. WD also offers the option to write additional information to the log.
- CLF. This is how Apache is logging. It contains most information needed.
- CLFMOD. Same format as CLF, but without form fields and parameters for security reason.
- SAP: writes basic information and no client IP, but contains processing time on SAP Application Server. This is a field you really will need.
- SMD: For SolMan Diagnostics and same as SAP, but contains the correlation ID.
As mentioned before, for CLF logstash comes with everything already configured. A log level that makes sense is SMD because of the response time. In that case, logstash must be configured to parse correctly the WD log. Logstash uses regular expressions to extract information. To make logstash understand SMD log format, the correct regular expression must be made available. Grok uses the pattern file to extract the information from the log http://logstash.net/docs/1.4.2/filters/grok 🔗 The standard pattern file can be found here: https://github.com/elasticsearch/logstash/tree/v1.4.2/patterns 🔗
For instance, to extract the value of the correlation id when log format is set to SMD, the regular is:
CORRELATIONID [a-zA-Z]\[\-\]
For WD with SMD log the complete regular expression is
TEST2 \|
WEBDISPATCHER \[%{HTTPDATE:timestamp}\] %{USER:ident} ”(?:%{WORD:verb} %{NOTSPACE:request}(?: HTTP/%{NUMBER:httpversion})?|%{DATA:rawrequest})” %{NUMBER:response} (?:%{NUMBER:bytes}|-) \[%{NUMBER:duration}\] %{CORRELATIONID:correlationid} %{TEST2:num1}
When the IP is added to the WD log with SMD, the regular expression is
TEST2 \|
CORRELATIONID [a-zA-Z]\[\-\]
WEBDISPATCHERTPP %{IP:ip} \[%{HTTPDATE:timestamp}\] %{USER:ident} ”(?:%{WORD:verb} %{NOTSPACE:request}(?: HTTP/%{NUMBER:httpversion})?|%{DATA:rawrequest})” %{NUMBER:response} (?:%{NUMBER:bytes}|-)\[%{NUMBER:duration}\] %{CORRELATIONID:correlationid} %{TEST2:num1}
You can find an example pattern file here: https://github.com/tobiashofmann/wd_logstash 🔗. The standard grok pattern file defines regular expressions for user id, IPv4/6, data, etc.
The actual configuration file consists of three sections: input, filter and output. The input part defines the logs to read, the filter part defines the filter to be applied to the input and the output part specifies where to write the result to. Let’s take a look at each of the sections:
Input
input {
file {
type => “wd”
path => [“/usr/sap/webdispatcher/access*”]
start_position => “beginning”
codec => plain {
charset => “ISO-8859-1”
}
}
}
All files starting with access at directory /usr/sap/webdispatcher are being read by logstash. The codec parameter ensures URLs with special characters are read correctly. To all lines read a type named wd is added.
Filter
filter {
if [type] == “wd” {
grok {
patterns_dir => ”./patterns”
match => { “message” => ”%{WEBDISPATCHER}” }
}
date {
match => [“timestamp”, “dd/MMM/yyyy:HH:mm:ss Z” ]
}
mutate {
convert => [ “bytes”, “integer” ]
convert => [ “duration”, “integer” ]
}
}
}
The filter is applied to all lines with type wd (see input). Grok is doing the regular expressions and to find the customized patterns for WD, the patterns_dir parameter is used. The date value is given by the timestamp. If this is not set, logstash takes the timestamp when the line is read. What you want is the timestamp of the logged access time of the HTTP request. To facilitate later analysis, the values bytes and duration are transformed to integer values.
Output
output {
elasticsearch {
host => localhost
index => “wd”
index_type => “logs”
protocol => “http”
}
}
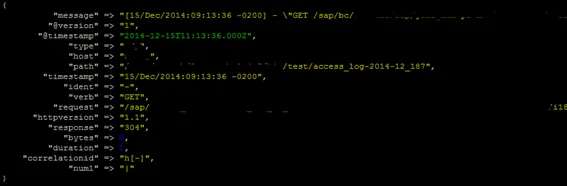
As output a local elasticsearch server is defined. The logs are written to the index wd to index type logs. This stores the log lines as a value to elasticsearch and makes it accessible for further processing.
A sample configuration file can be found here https://github.com/tobiashofmann/wd_logstash 🔗
Run logstash
To run logstash and let it read the WD logs, use the following command:
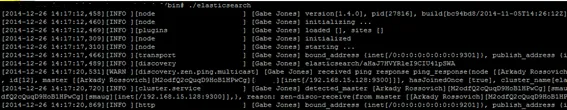
./logstash –f logstash.conf
This will start logstash. It takes a few seconds for the JVM to come up and read the first log file. Afterwards the log files are parsed and send over to elastic search.
![]()
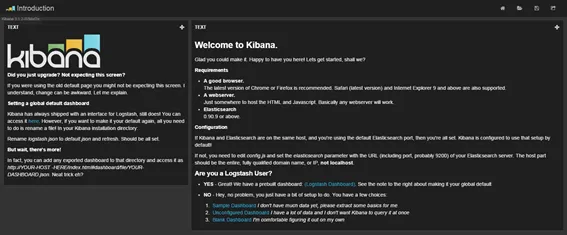
Kibana
Installation in 3 steps: http://www.elasticsearch.org/overview/elkdownloads/ 🔗
-
Go to the HTML directory configured for NGinx, like /var/www/html
Command: cd /var/www/html
-
Download Kibana 3: https://download.elasticsearch.org/kibana/kibana/kibana-3.1.2.tar.gz 🔗
Command: wget https://download.elasticsearch.org/kibana/kibana/kibana-3.1.2.tar.gz 🔗
-
Extract archive
Command: tar –zxvf kibana-3.1.2.tar.gz
-
Configure nginx
Add a location in nginx configuration file to make the kibana application available under /kibana
Location /kibana {
alias /var/www/html/
}
-
Access Kibana on web browser: http://webserver:port/kibana 🔗