

SAP Web Dispatcher (WD) is the entry point of your users that access your web enabled applications. These can be any HTML service or app you have running on NetWeaver, or other systems like HANA XS. For over a decade WD offers reverse proxy functionality for SAP systems, and while until shortly its main usage area was SAP Portal and Web Dynpro applications, with the rise of Fiori WD is more exposed. Naturally, more and more companies will use it. Of course WD can be integrated into SolMan and therefore can be managed and monitored.
While this is nice, analytical requirements for a web application can be quite complex. A standard approach is to use a web analytics application that helps you to find out how your site is used (sessions, entry/exit points, campaigns). While this gives you transparency about the site experience of your end users, it is not really useful when it comes to a more administratively driven approach: what kind of content is passed through WD, impact on configuration parameters: CSS, JavaScript, response times, data throughput. Besides, your users must be OK with the tracking code and modern browsers allow users to deactivate tracking cookies and related technology (do not track).
WD is the single point of entry to web applications; it contains viable information about their usage. This information can heavily influence the understanding of the app. Think about finding the bottlenecks of the app, the most accessed resources, usage patterns, and so on. The log of the web dispatcher contains all this kind of information. You only have to gather it, store it and analyze it.
Basically, WD is a reverse proxy, and in the non-SAP context, Apache is one of the most used reverse proxies. Analyzing HTTP traffic is a common task for web site administrators, and so it is not a big surprise to find a huge list of Apache traffic analyze log tools available. The Swiss army knife among them is logstash. Now, logstash does not really analyze web server logs. It rather parses them and can send them to another tool for storing and analyzing the data. Like elasticsearch.
This is the default use case of logstash: Parse logs, extract the information and send it to elasticsearch for storing and retrieval. After the information is stored in elasticsearch, it can be used by Kibana for retrieving information like statistics and analytical data. Think about access statistics or trends.
The vantage of the combination of logstash, elasticsearch and Kibana over a web analytic app is that you do not have to install a tracking / analyzing part in your web application. You can also analyze part of your web page normally invisible, like resources. Depending on your WD configuration, you gain insights into how WD works, like how long it takes to retrieve files from the SAP system.
Information retrieval
After connecting Kibana to elasticsearch it is easy to surf the data and to create your own dashboard. Drilling down is no problem and while logstash is running in the background adding new data, the dashboard can reflect this instantly. A few sample reports may include:
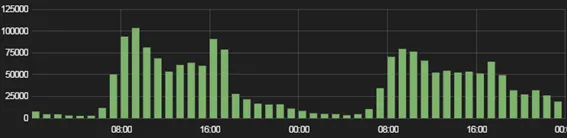
Total number of files served by WD
![]()
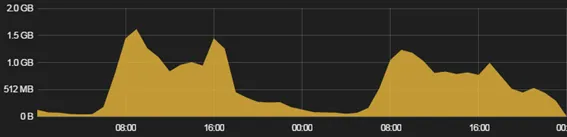
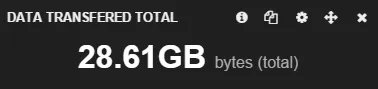
Total number of MB transferred
![]()
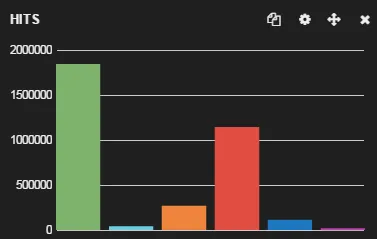
Hits to resouces
![]()
You can correlate this data to find out interesting stuff like:
-
Number of requests: a cached resource is served locally by browser, this can decrease drastically the load on WD and backend.
-
Requests for a specific file / site
-
Average response time for CSS or JS files: does it make sense to use WD as a web cache? Think about it: the data may indicate that WD waits to retrieve a file from ICM, multiply it with the numbers of requests it takes for a user to access a resource and you have an idea of time wasted.
-
Data send by serving static files: is your cache configuration correct?
-
What is the largest file requested?
-
Usages: your application is accessible only internally, does the access statistics reflect this?
-
Hitting a lot of 304, 404 or 500? What is causing this?
-
Monitor ICM admin resources to find out possible attack vectors.