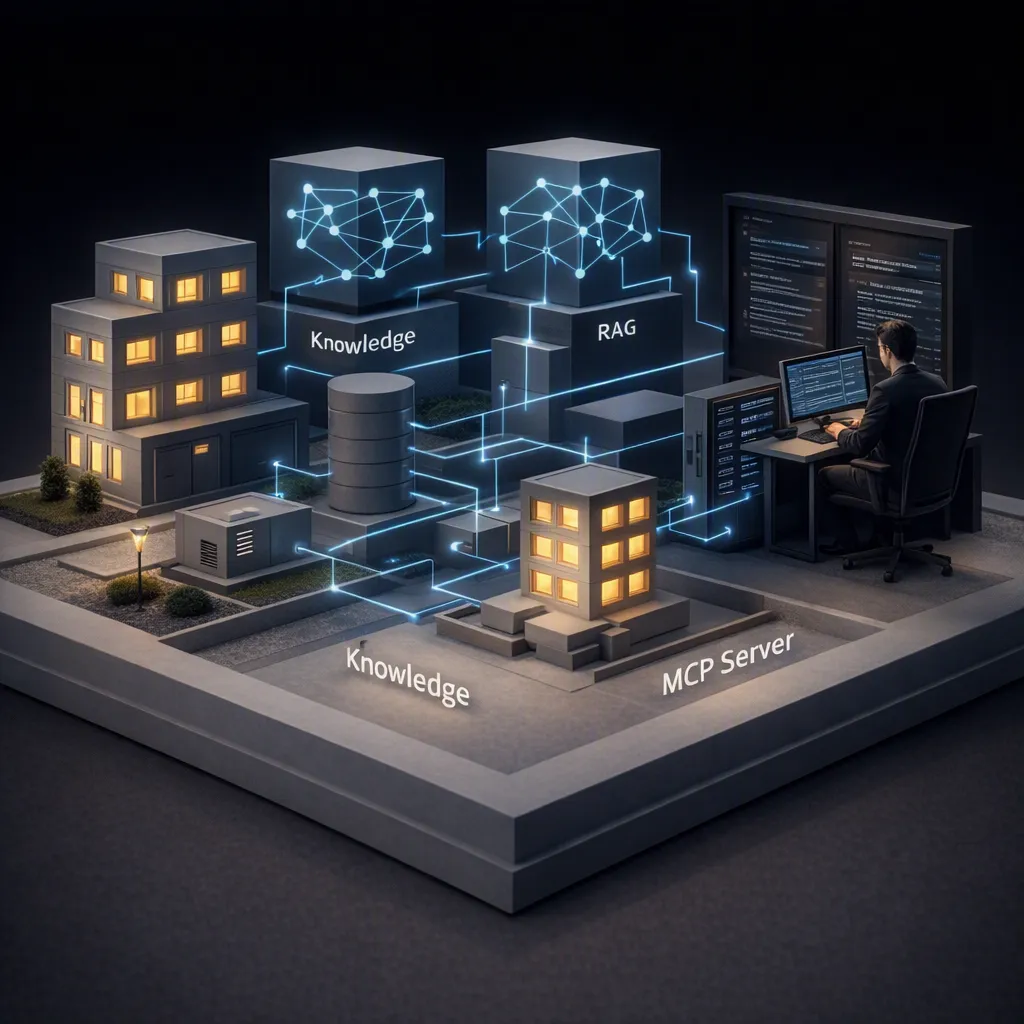
Debug a portal application

Published by Tobias Hofmann on

2 min read

Note: 1st published on SCN on 25. 5. 2012

Debugging an application comes down to see what is going on during execution of the application. One way of debugging is to log specific messages to a file. To get e detail analysis of the program flow you set breakpoints. These breakpoints are set in your source code and are instructions of the Java VM to stop execution when it hits a breakpoint. After the execution stopped you can see the current values of variables.

The instructions here are for SAP Portal 7.x, but the overall process should be the same for the 7.3 portal.

Before you can start debugging a portal application (PAR) you have to enable the debug option on your portal server. This means that you will enable a specific debug port to which your NWDS will connect. To actually debug the portal application you’ll use NWDS. This implies that you rarely will activate and execute a debug session in your productive portal environment. If you have debug a PAR that already is in production, something is wrong with how you release software.

The debug port is activated using the configtool. You set the debug port to an arbitrary value, just make sure that the port is free.

In the portal application, set breakpoints where you want the Java VM to stop execution so you can take a closer look at the VM environment.

This will instruct the VM to stop every time the array a gets a value assigned. Next step is to deploy the PAR. Make sure that you select the option: “Include the source code of the portal application”. If not, the debug won’t work.

To actually start the debug session you create a remote java application configuration:

Specify the portal project, the server and debug port (the one you gave in configtool). After clicking on debug, NWDS will connect to the Java VM and already present you with some nice information of the VM:

When you now execute the PAR, the Java VM will stop the application where you have set the breakpoint.

You can start exploring the current state of your application. The variables are shown with their current values:

To gain a deeper understanding of the environment of the PAR, you can also look at the request object and find out variables and their values:

Resuming execution and the values are being updates:

Let the world know
Categories: PortalSAP

Tobias Hofmann

Doing stuff with SAP since 1998. Open, web, UX, cloud. I am not a Basis guy, but very knowledgeable about Basis stuff, as it's the foundation of everything I do (DevOps). Performance is king, and unit tests is something I actually do. Developing HTML5 apps when HTML5 wasn't around. HCP/SCP user since 2012, NetWeaver since 2002, ABAP since 1998.

0 Comments

Leave a Reply

Avatar placeholder

Your email address will not be published. Required fields are marked *

This site uses Akismet to reduce spam. Learn how your comment data is processed.