SAP UI5 VIZ charts in Chrome
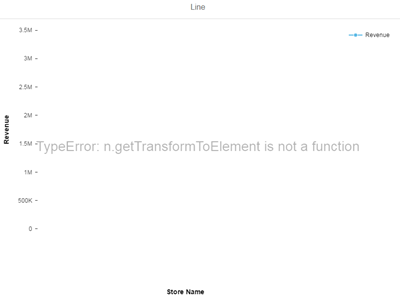
I was preparing a demo showing how to visualize data from an IoT service using SAP UI5 VisFrame charts. To play around with VizFrame, I used the sample from SAPUI5 SDK. It was working perfectly on the online version, but while running the UI5 app and Chrome, I got an error message.
Googling for the error message revealed that with Chrome 50 a known error exists which makes it impossible to use a VizFrame chart. Luckily I found the solution on SCN. All it takes is to implement the function as a prototype and the chart will work.
SVGElement.prototype.getTransformToElement = SVGElement.prototype.getTransformToElement || function(elem) { return elem.getScreenCTM().inverse().multiply(this.getScreenCTM()); };
I`ve put the code in my views controller init() function:
onInit : function (evt) {
  SVGElement.prototype.getTransformToElement = SVGElement.prototype.getTransformToElement || function(elem) { return elem.getScreenCTM().inverse().multiply(this.getScreenCTM()); };
  oVizFrame = this.oVizFrame = this.getView().byId("idVizFrame");
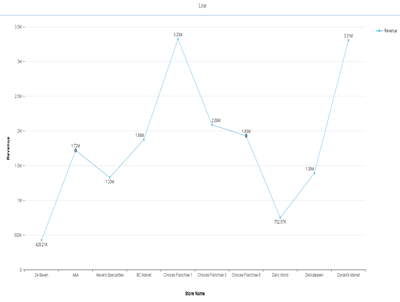
Result
Now, this works magically when I access the online SDK, but is broken when using it locally. I guess SAP did some magic either in the SDK or in the UI5 library that my SAPUI5 version does not include. Either way, the above trick solves the problem.


0 Comments