A look back at 2015
2015 is history. Time to look back and to analyze the past year to make better decisions. What happened in 2015? Well, I started my own web site. I left SCN as my go to blogging platform, so I needed a new one. While there are a lot of free cloud alternatives available, I wanted to have control and insight over my content.
It was around February when I bought my Raspberry Pi B+ and registered my own domain. At the end of the year I got a Raspberry Pi 2 and that one took over the task of hosting this very own website. The RP1 is now serving as a pure OpenELEC media center. Software I use on the RP2 is “pure” Debian. It is not Rasbian anymore, with RP2 I started using the real deal. Apache is the web server, and I only serve my content via TLS. No SSL and no HTTP. WordPress is the blogging software, Piwik is used for analytics. Initial go live was around February, but the real go live was in March. This means that I had my site up and running for about 9 months in 2015. What was achieved in these 9 months? Let`s take a look at the numbers:
I wrote 156 blogs and published 116 of them. 156 blogs in 9 months means around 17 per months, but I took off 1 month of well deserved holidays, so it was actually almost 20 blogs per month. That`s an insane high number of blogs per month/week. On my laptop are already drafts for way more blogs, so this number will grow still drastically in 2016.
Having content is nice, but worth nothing without an audience. My focus is SAP related, and to a very specific area: mobility in all its aspects: Fiori, Gateway, SMP3, etc. In 2015, I managed to attract more than 4200 unique visitors. In total, I had slightly over 10.000 page visits by 5815 visitors. I think this is not bad. Looking at my content, I guess a high % of people working as SAP consultants working with these technologies passed by my site.
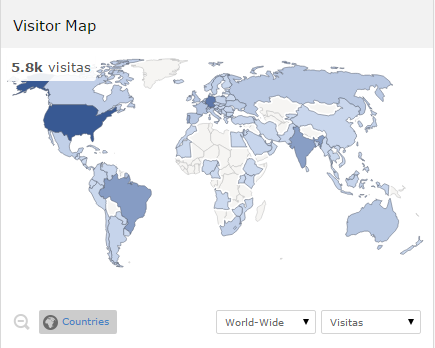
These numbers are only for www.itsfullofstars.de and not for the subsites I created for the SAP Inside Tracks. Where did my visitors come from?
As you can see, from around the word. IMHO the map accurately shows the real distribution of SAP clients. Americas, Europe, Australia and Asia is good, Africa only in the more “developed” countries. From time to time I post a blog at SCN summarizing a set of blogs on my site. I get a nice amount of visitors through SCN, but Google leads. More than 3.000 hits came from Google search (and yes, forget Bing). Actually, Twitter, LinkedIn, G+ and other sites sum up to more visits than from SCN. Big surprise for me, as SCN is still THE site for SAP professionals to go to. Although other sources are raising. In 2016 I`ll try to make a better use of LinkedIn to promote my site and content. Btw: even with almost stopping using SCN for blogging, I still managed to get to the elite circle of 15k and am now 2 digit in the global ranking (99th place).
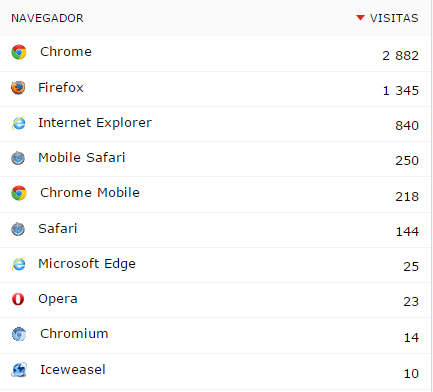
What are my users using when accessing my site? Chrome and FF. The mobile users also sum up to a nice amount, albeit desktop users lead by far.
I planned to show some hard data like MB served by my site, but I lost a huge amount of Apache 2 log data for some unknown reason. The data gap is several months, so it makes no real sense to show that data. To make sure that this won`t happen again in 2016, I run now also ELK on this RP2. The data for ½ of December shows me that I have served 500 MB of data. Scaling this simply up would mean 1 GB per month == 12 GB in one year. I`ll try to validate this in 12 months.
See you in 2016 on my site. Hope you enjoy my content.


1 Comment
A look back at the first 4 month in 2016 | It`s full of stars! · April 28, 2016 at 11:03
[…] the beginning of this year, I published a review on my blog activities in 2015. In 2016, I do not want to wait 12 month to give my readers an overview on how my private blog is […]