Debugging a UI5 app
Developing UI5 apps means that sooner or later you’ll have to debug them. If you are in the local development phase this is easy. The UI5 files loaded by the browser are the same as the ones in your IDE. This changes after a deploy to the Fiori Launchpad. Then a performance optimized version is loaded: Component-prebuild.js. This file contains minimized JavaScript and not any longer human readable or usable for debugging in a browser. UI5 is enterprise ready software, making it possible to debug UI5 apps even in production.
Local development
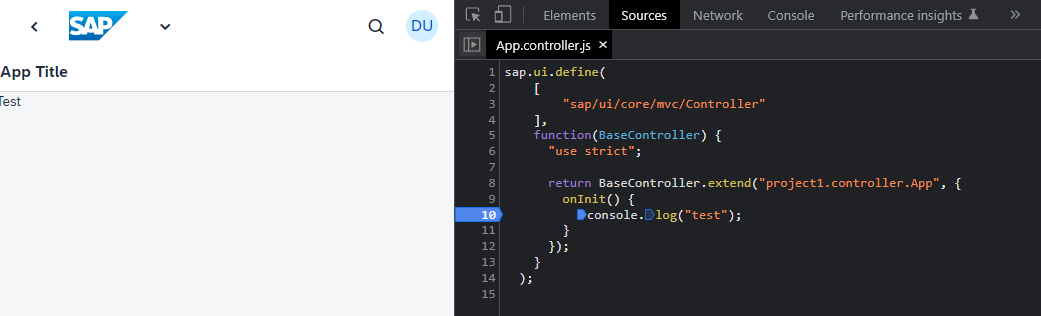
Running a UI5 app locally or from BAS in a browser shows that the source code is provided as-is. Opening the file in the developer console allows to read the source code and set breakpoints. The preview is run from the webapp folder. As long as you are not using TypeScript, this is the same file as in your code editor.
Deploy step
In the process to deploy a UI5 app, the UI5 tools are used to build the artifacts. During this step the files of the app are optimized and stored into one single file: Component-preload.js. This file contains all the source code of the app. Good for the end user (performance), bad for the developer: the resulting file is not debug friendly.
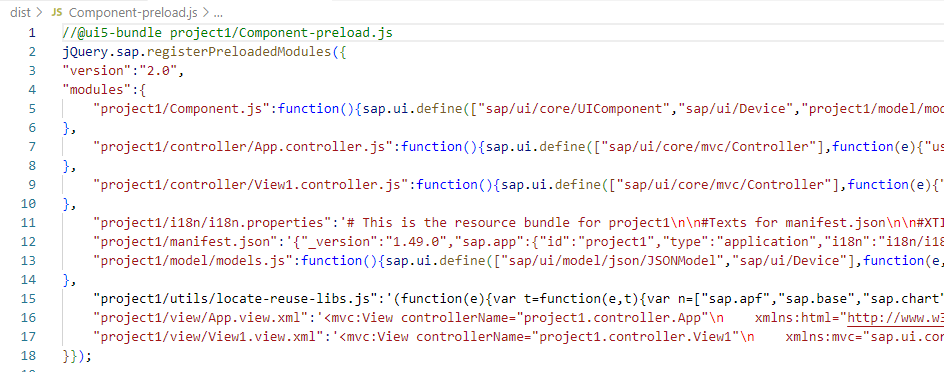
Calling the UI5 app from the Fiori Launchpad will load the Component-preload.js version.
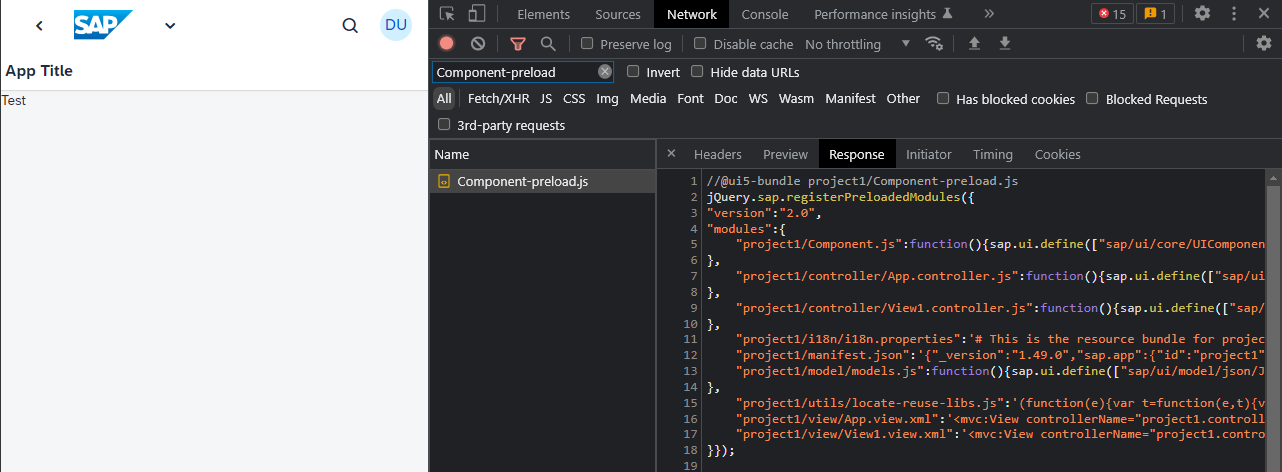
While your debug messages (console.log or Logger) are still logged and visible in the console output, you cannot simply click on the shown line of source code to start debugging.

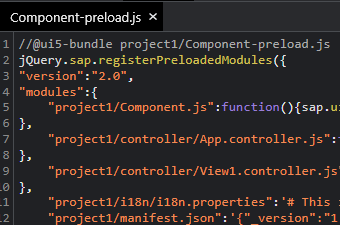
A click will bring you to the 7th line in Component-preload.js, which is the minimized form of the App.controller.js. No chance to set a break point at the init() function using this file.
Access in production
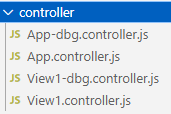
Normally the “original” files are also deployed. The UI5 build process stores the original developer files as -dbg.controller.js and the minimized version to controller.js. In case someone did not take care of this, it is always possible to gain access to the original source code.
Accessing the original files is easy. You can enforce the loading of the -dbg (debug) files. This gives access to the developer friendly version, not the version optimized for performance. This is done by simply adding the parameter sap-ui-debug=true to the URL.
<path to FLP server>flp?sap-ui-debug=true
While this works just fine, it comes with a few drawbacks:
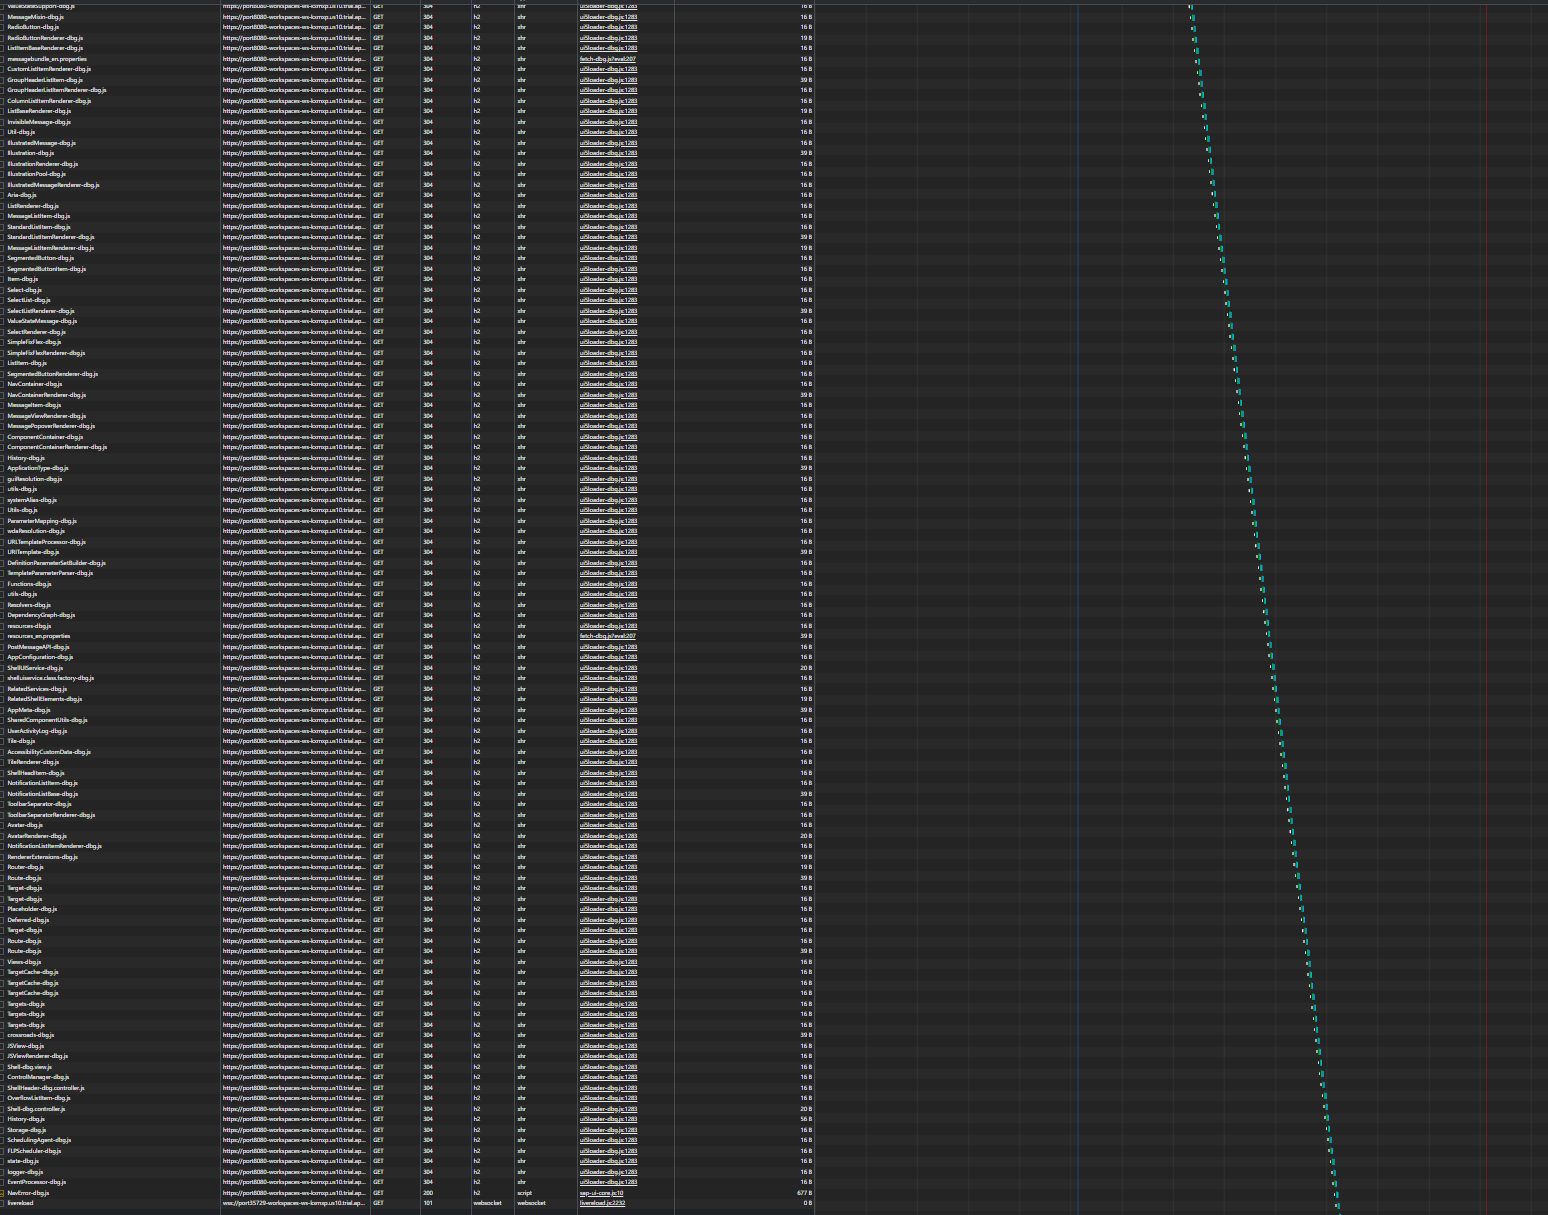
This loads the debug version of everything. Not just for your app, but also for the UI5 framework. For a very simple UI5 app the number of requests is over 1.000.

The loading time and data traffic increases drastically. But the requests to UI5 look nice in the network tab.
Note: this won’t work using the evergreen bootstrap version. The UI5 documentation contains a note regarding this specific case and also how to solve this. The linked blog from Peter Müssig nicely explains a solution: enable the loading of debug files for given namespaces.
Activate debugging for namespace
Loading the debug files of everything UI5 is not best practice. You are only interested in the debug files of a specific app. An option to just load the debug files for this app is needed. The UI5 documentation contains since a very, very long time a section about this possibility.
“If you only want to load the debug sources for specific packages, you have the following options: Add the module names to the sap-ui-debug URL parameter, separated by a comma.” [UI5]
In my example, the App is using the namespace project1. It could also be tld.company.org.project.
sap-ui-debug=project1/
To activate debugging for e.g. only the apps in your company namespace, it would be:
sap-ui-debug=tld/company/
Setting the sap-ui-debug parameter to the app namespace will load everything not related to the UI5 app normally, while for the app the debug files will be loaded. Nice side effect: loading the debug sources is faster. The UI5 framework loads as fast as always, only for the UI5 app you want to debug the debug files are loaded.
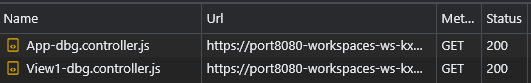
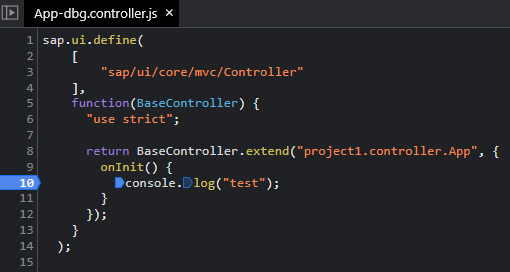
The debug message shown in the console is still working, and the file shown as origin is now again the App controller file App-dbg.controller.js and not Component-preload. This allows to debug a deployed app the same way as when developing it locally.

Clicking the filename opens the debug version and you can set a breakpoint. Next time the app is calling this line, the breakpoint will work.
Lessons learned
Don’t use sap-ui-debug=true. Always provide the namespace of your app. Rarely you need to load the debug sources of the UI5 framework. This not only helps to save time and traffic but enables you to debug your app when using an evergreen UI5 version.
0 Comments